

Code analysis is more complex than ever. We could argue this is due to the advent of tools like Claude Code, Cursor, and their peers. That makes it even more important to grasp a codebase quickly. To help with that, I’ve added new tools and metrics to Detective to surface anti-patterns and identify hotspots faster.
Let’s start with the new tool: Hotspot City. The idea is to render a 3D city based on your code and use footprint/height to visualize LOC and complexity, and color to visualize the score. Here’s a screenshot—but I recommend trying it so you can explore the scene in 3D.
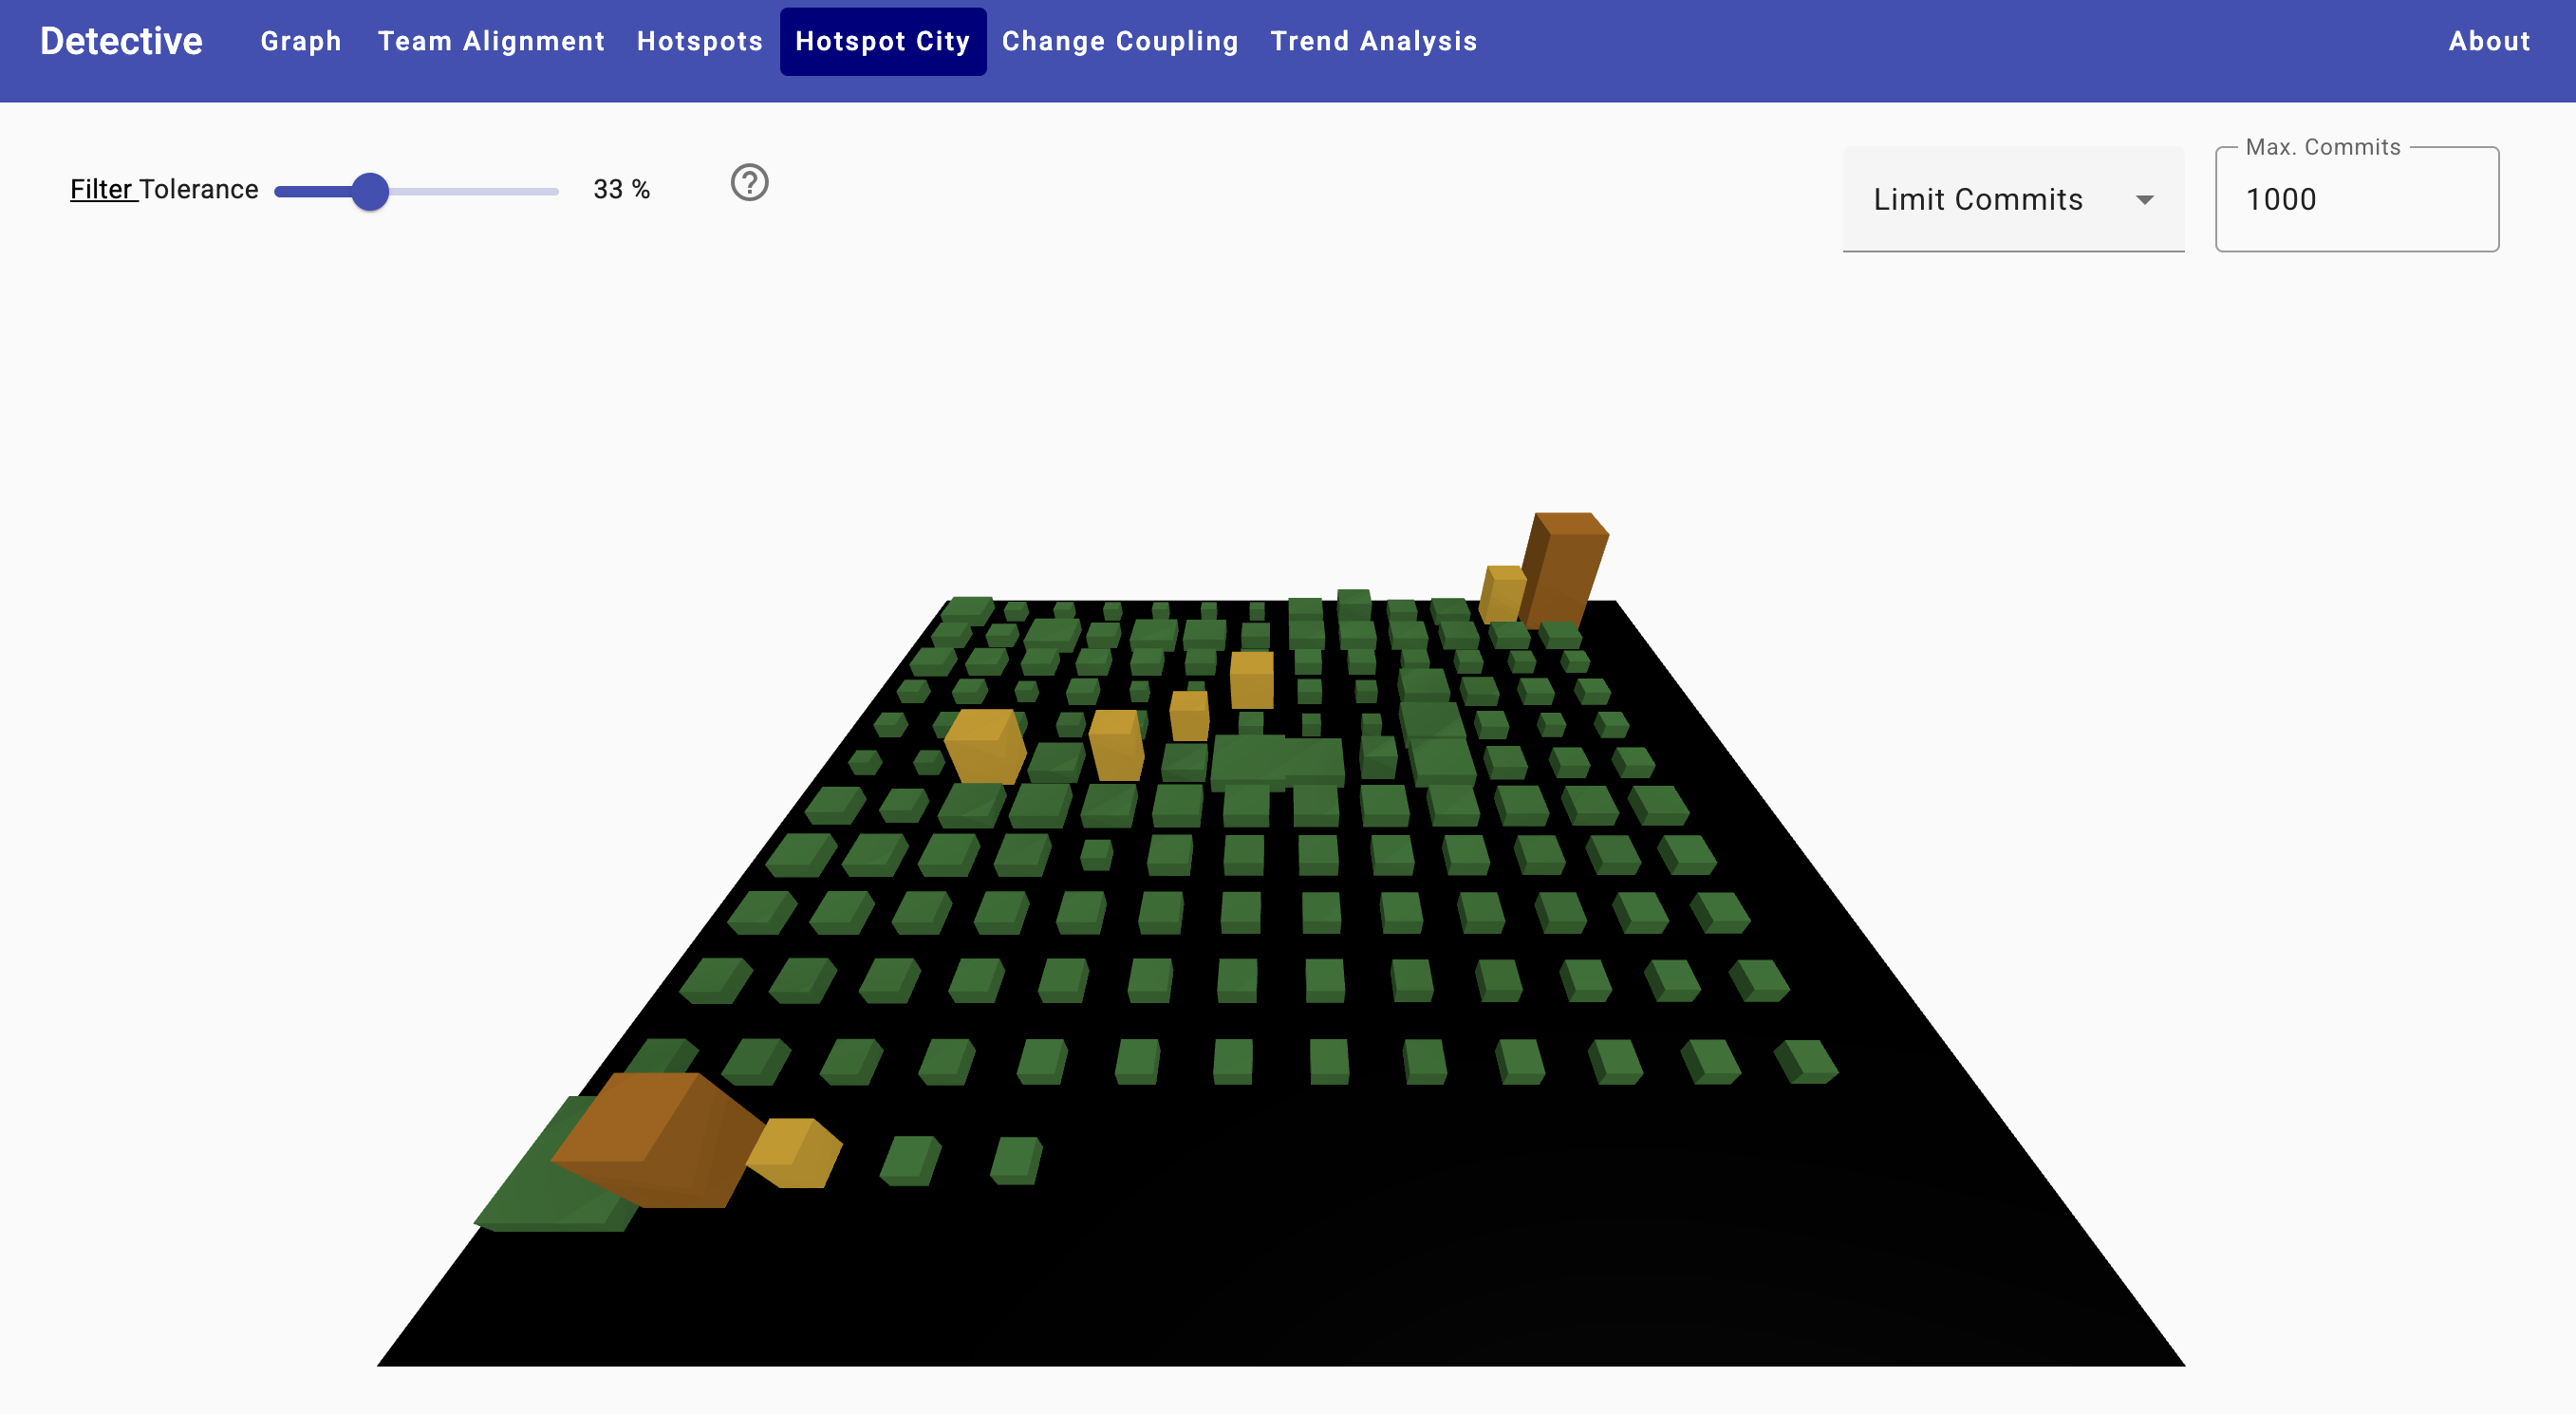
You can manipulate the scene; even more importantly, you can hover over buildings to see key facts about them.
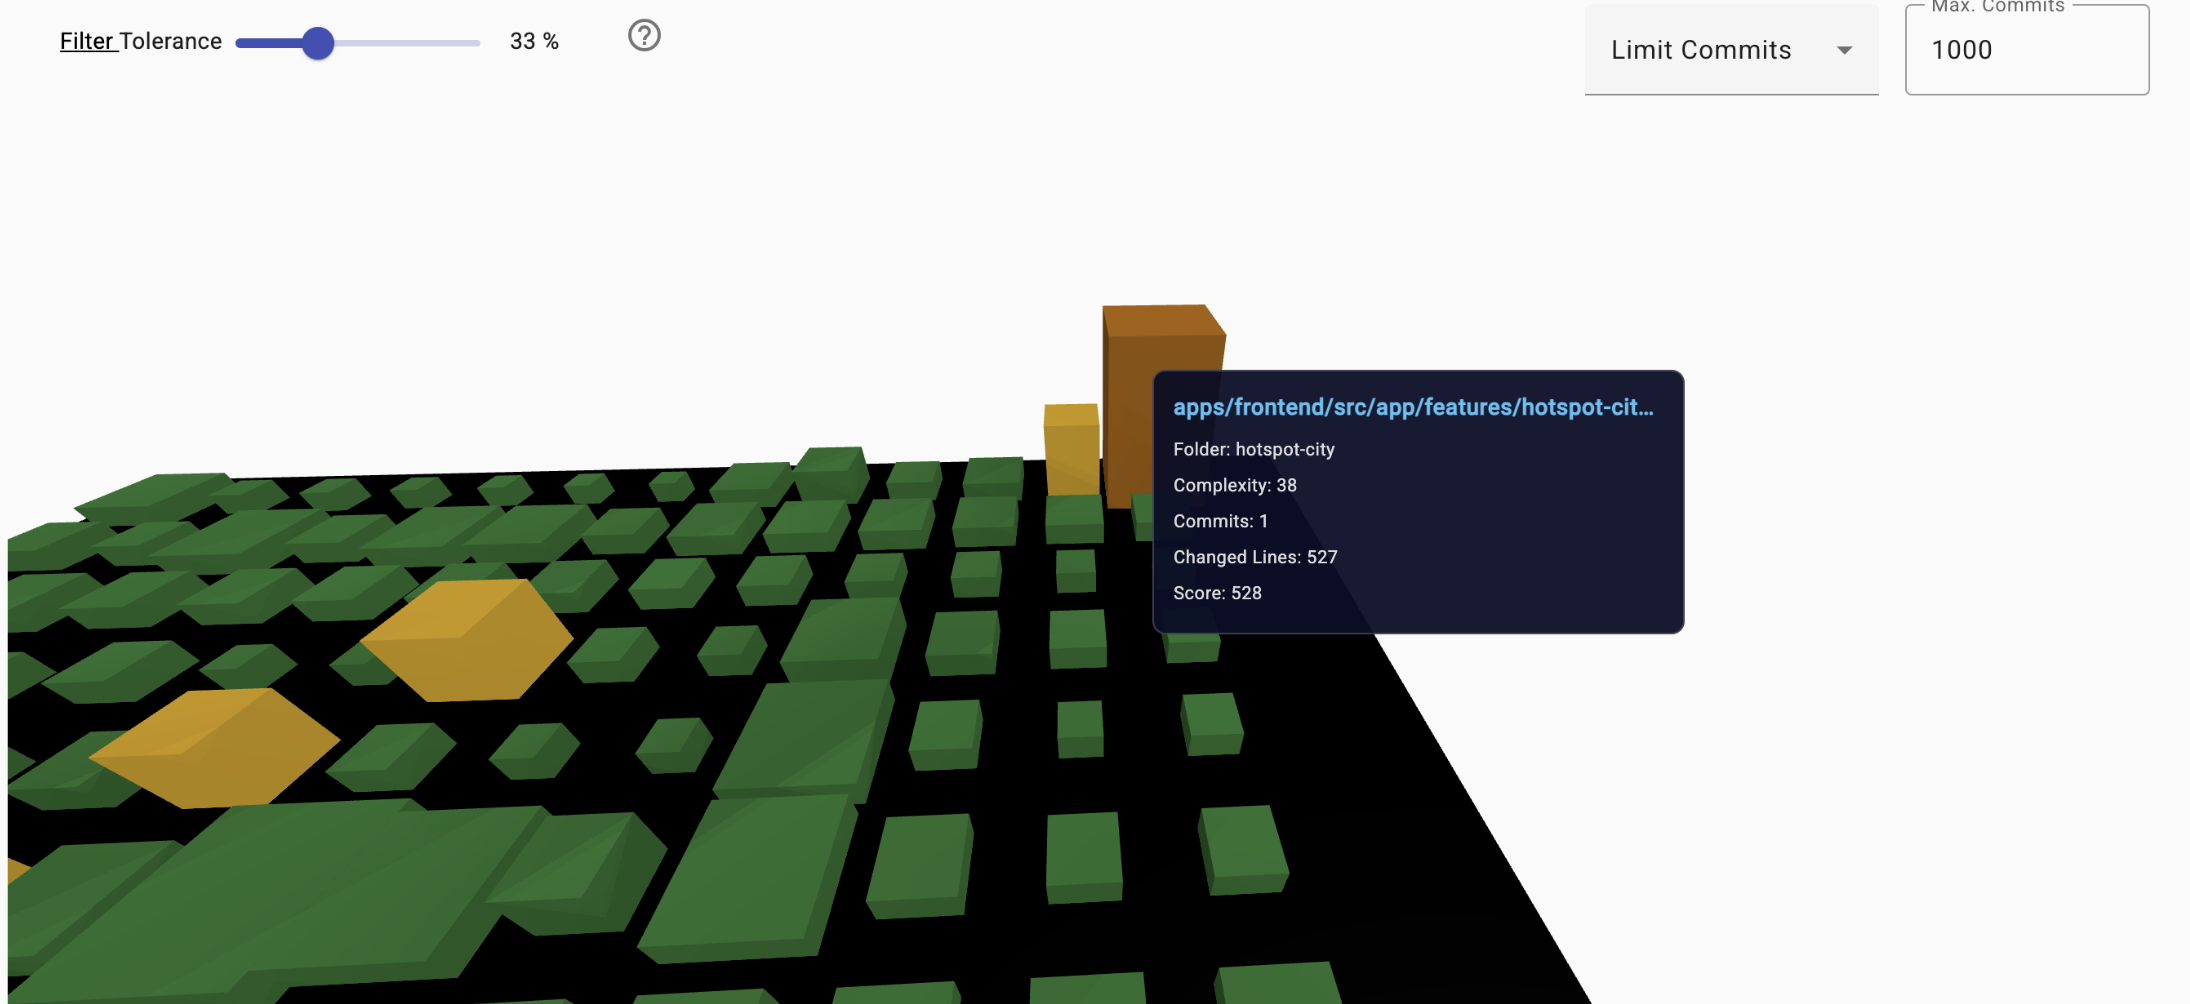
That already provides useful visual feedback on your codebase, but often we need more context.
To address that, Detective introduces metrics. These metrics currently operate at the file level. When you click a building, the X-Ray view opens and computes metrics for that file.
We analyze three categories:
- Methods (analysis at the method level)
- Classes (we parse all classes in the file)
- Code Quality (hints derived from the TypeScript AST to uncover possible bad patterns)

For class-level analysis, we report the following metrics:
- Methods — Number of methods in the class
- Fields — Number of fields
- Class complexity — Cyclomatic complexity of the class
- File complexity — Cyclomatic complexity of the file
- Unused members — Count of unused private/super-private members
- Dependencies — A heuristic that detects constructor-injected or public member fields with type names matching patterns like Service, Manager, and so on
- This helps, especially in Angular, to spot classes that inject too much and hurt testability
- Reasons to change — An estimate of whether the class violates the Single Responsibility Principle. As a heuristic, we look at used types and classify them. For example, if we detect
HttpClient, we tag the class as “networking.” If we detectDocument, we add the tag “dom.” Multiple tags suggest the class spans layers, which is a signal to investigate.
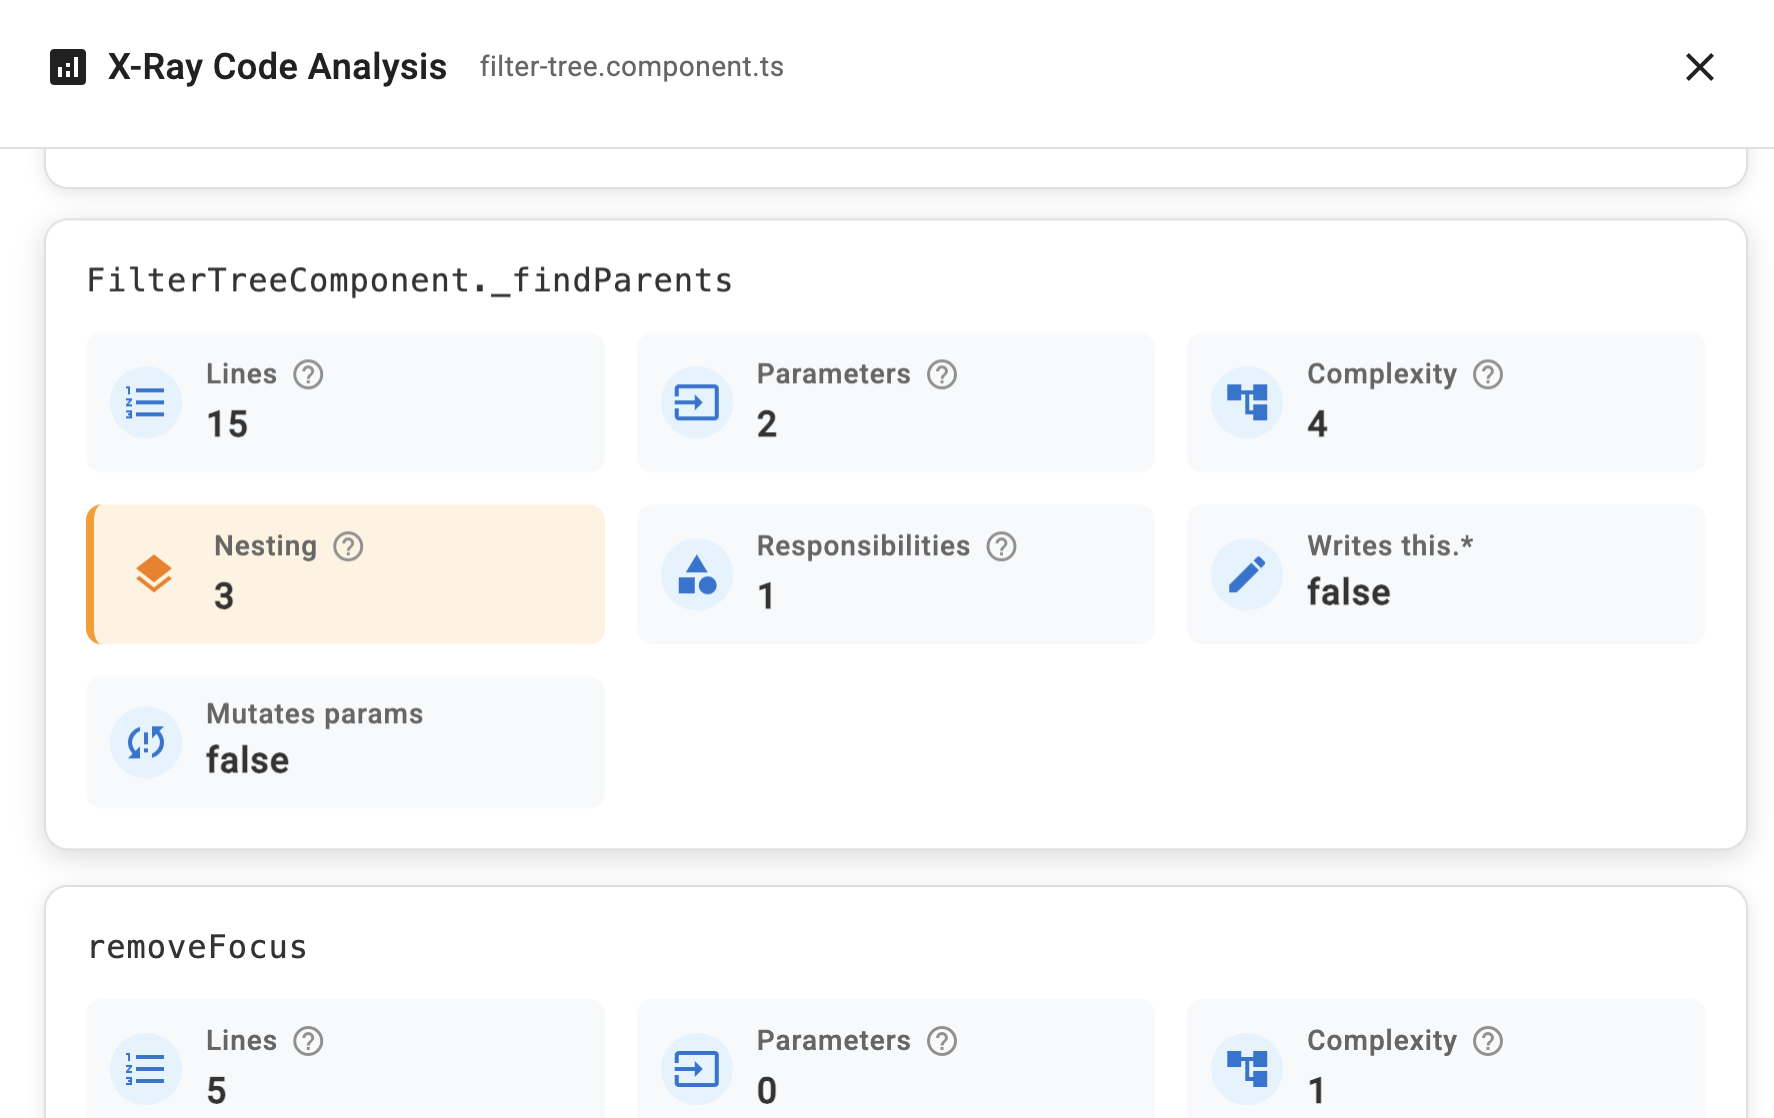
For method-level analysis, we include:
- Lines — Lines of code in the method
- Parameters — Helpful for spotting primitive obsession
- Complexity — Cyclomatic complexity of the function
- Nesting — Maximum nesting depth of conditionals in the method
- Reduce nesting for readability and maintainability
- Responsibilities — As above, but scoped to the function
- Writes
this.*— Method mutates object state (this.*) - Mutates params — Method reassigns or mutates its parameters
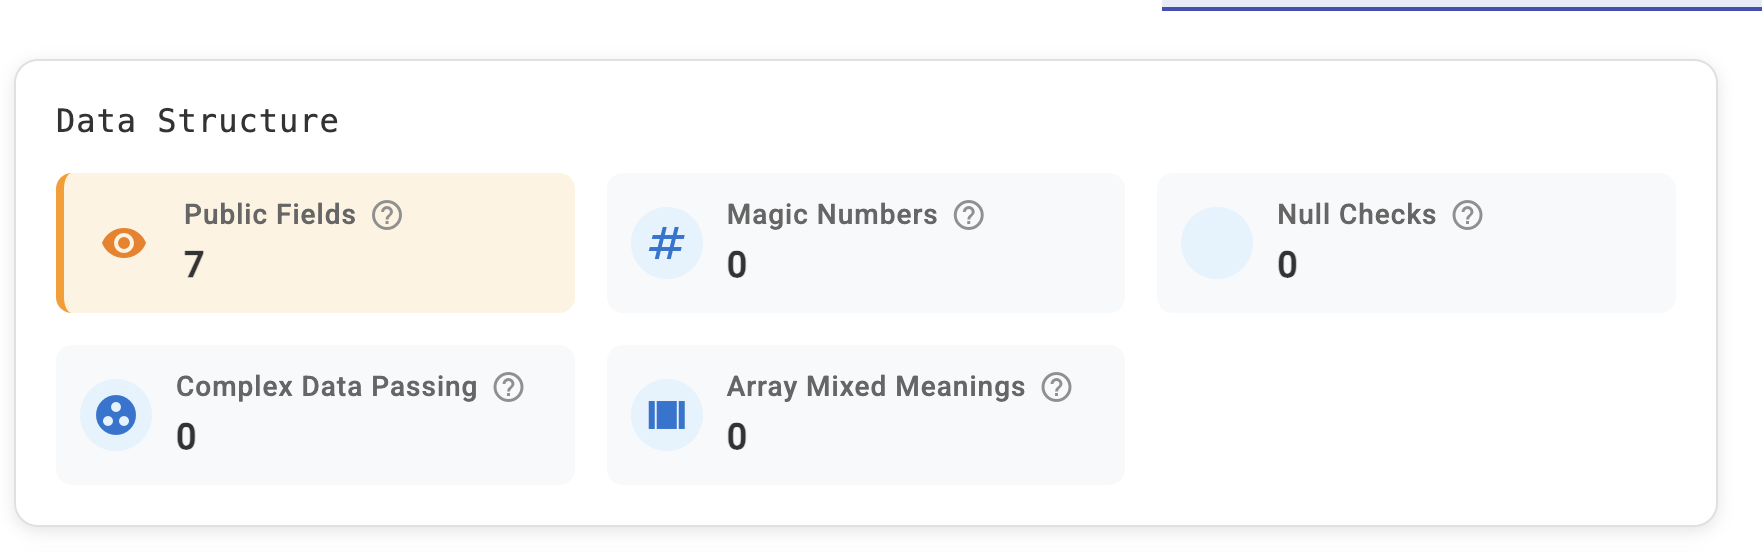
The final tab is the Code Quality tab, split into three sections: “Data Structures,” “Code Organization,” and “TypeScript Quality.”
In “Data Structures” we offer:
- Public fields — Counts public fields, ignoring Angular concepts like signals
- Magic numbers — Detects unnamed numeric literals
- Null checks — Non-strict (
==/!=) null checks are error‑prone. Prefer===/!==or explicit nullish handling - Complex data passing — Detects large object literals/destructures in calls or signatures
- Array mixed meanings — Arrays containing mixed element kinds (for example, numbers + objects) often hide multiple responsibilities
In “TypeScript Quality” we include:
- Any types — Detect usage of the
anytype - Type assertions — Detect assertions that may hide runtime errors
- Complex unions — Large unions increase complexity
- Missing type guards — Prefer narrowing with guards
- Weak type definitions — All‑optional interfaces are weak
- Type duplication — Detect duplicate type shapes, for example:
interface A { id: number; name: string }
interface C { id: number; name: string }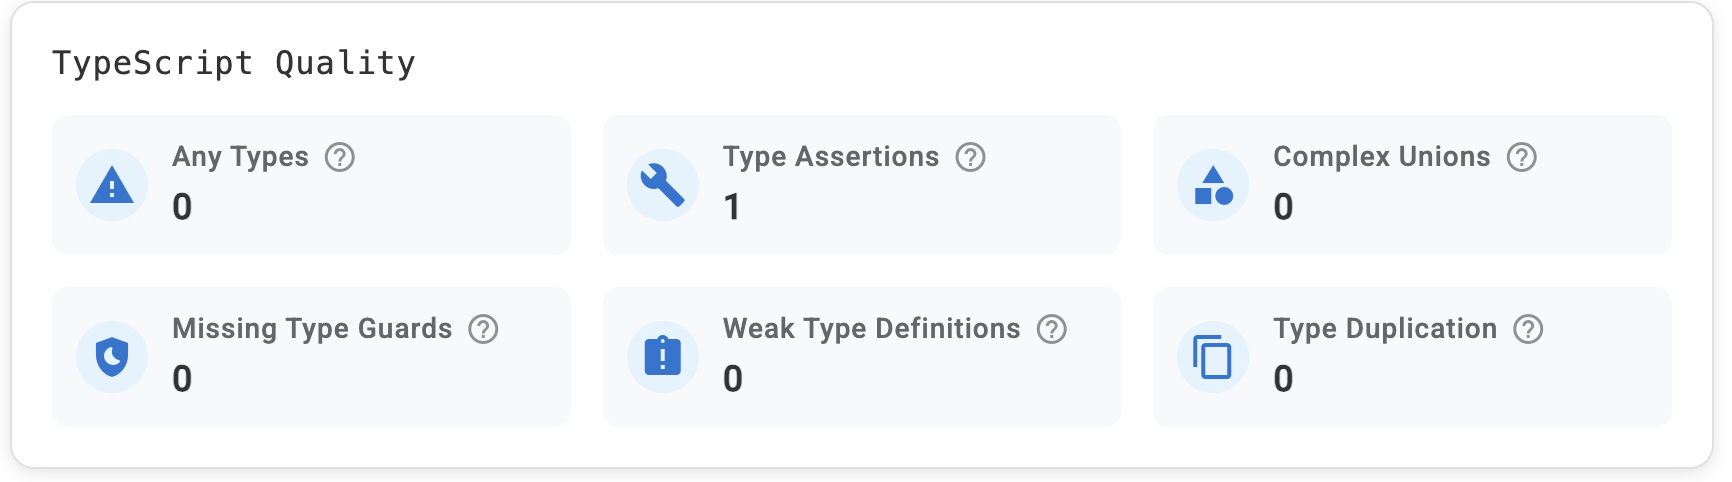
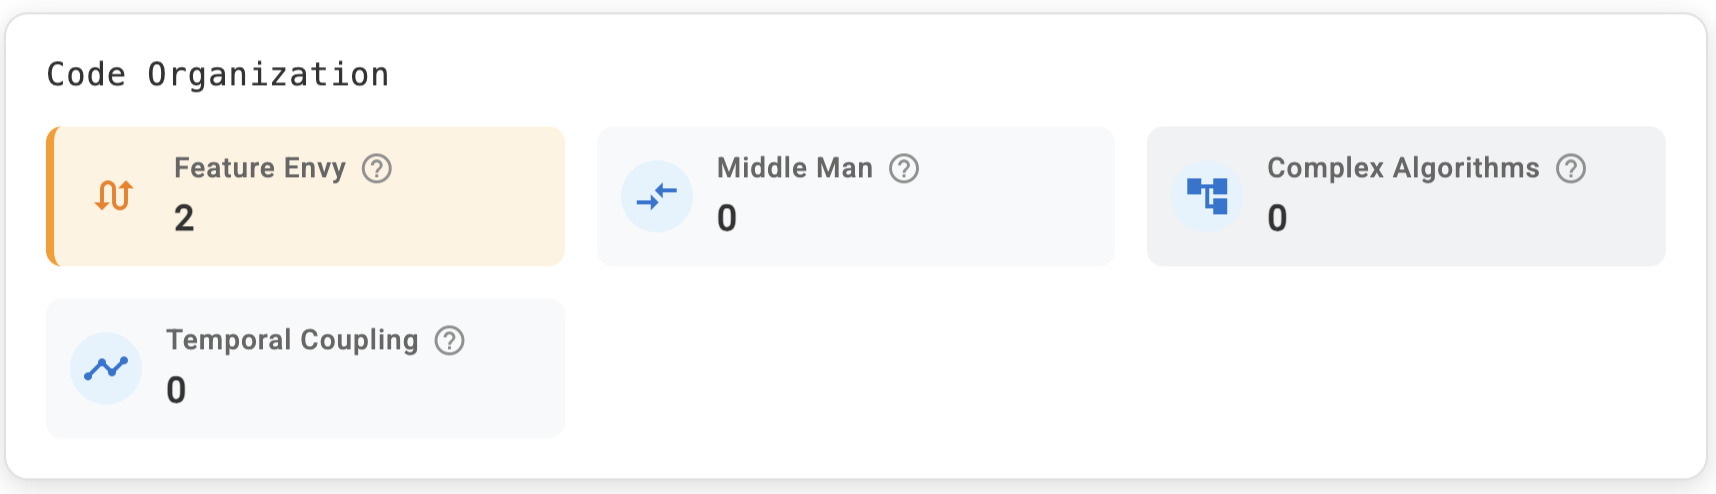
Finally, in “Code Organization” we have:
- Feature envy — Counts methods that access properties on parameters (foreign data) significantly more than their own state; triggered when a method reads fields on its parameters at least three times and more often than it accesses
this - Middle man — Counts classes where most methods are one‑liners that delegate to another object (for example,
this.dep.method(...)) or to a parameter - Complex algorithms — Counts functions/methods likely to be hard to understand or change, based on two heuristics: cyclomatic complexity ≥ 15 or maximum nesting depth ≥ 4. High control‑flow complexity and deep nesting reduce readability and maintainability
- Temporal coupling — Counts fields written in one method and later read inside a conditional in a different method. This indicates an implicit ordering dependency between methods. If one method must run before another for correct behavior, the class may exhibit temporal coupling
X-Rays are invaluable for highlighting where to look closer and assessing potential issues.
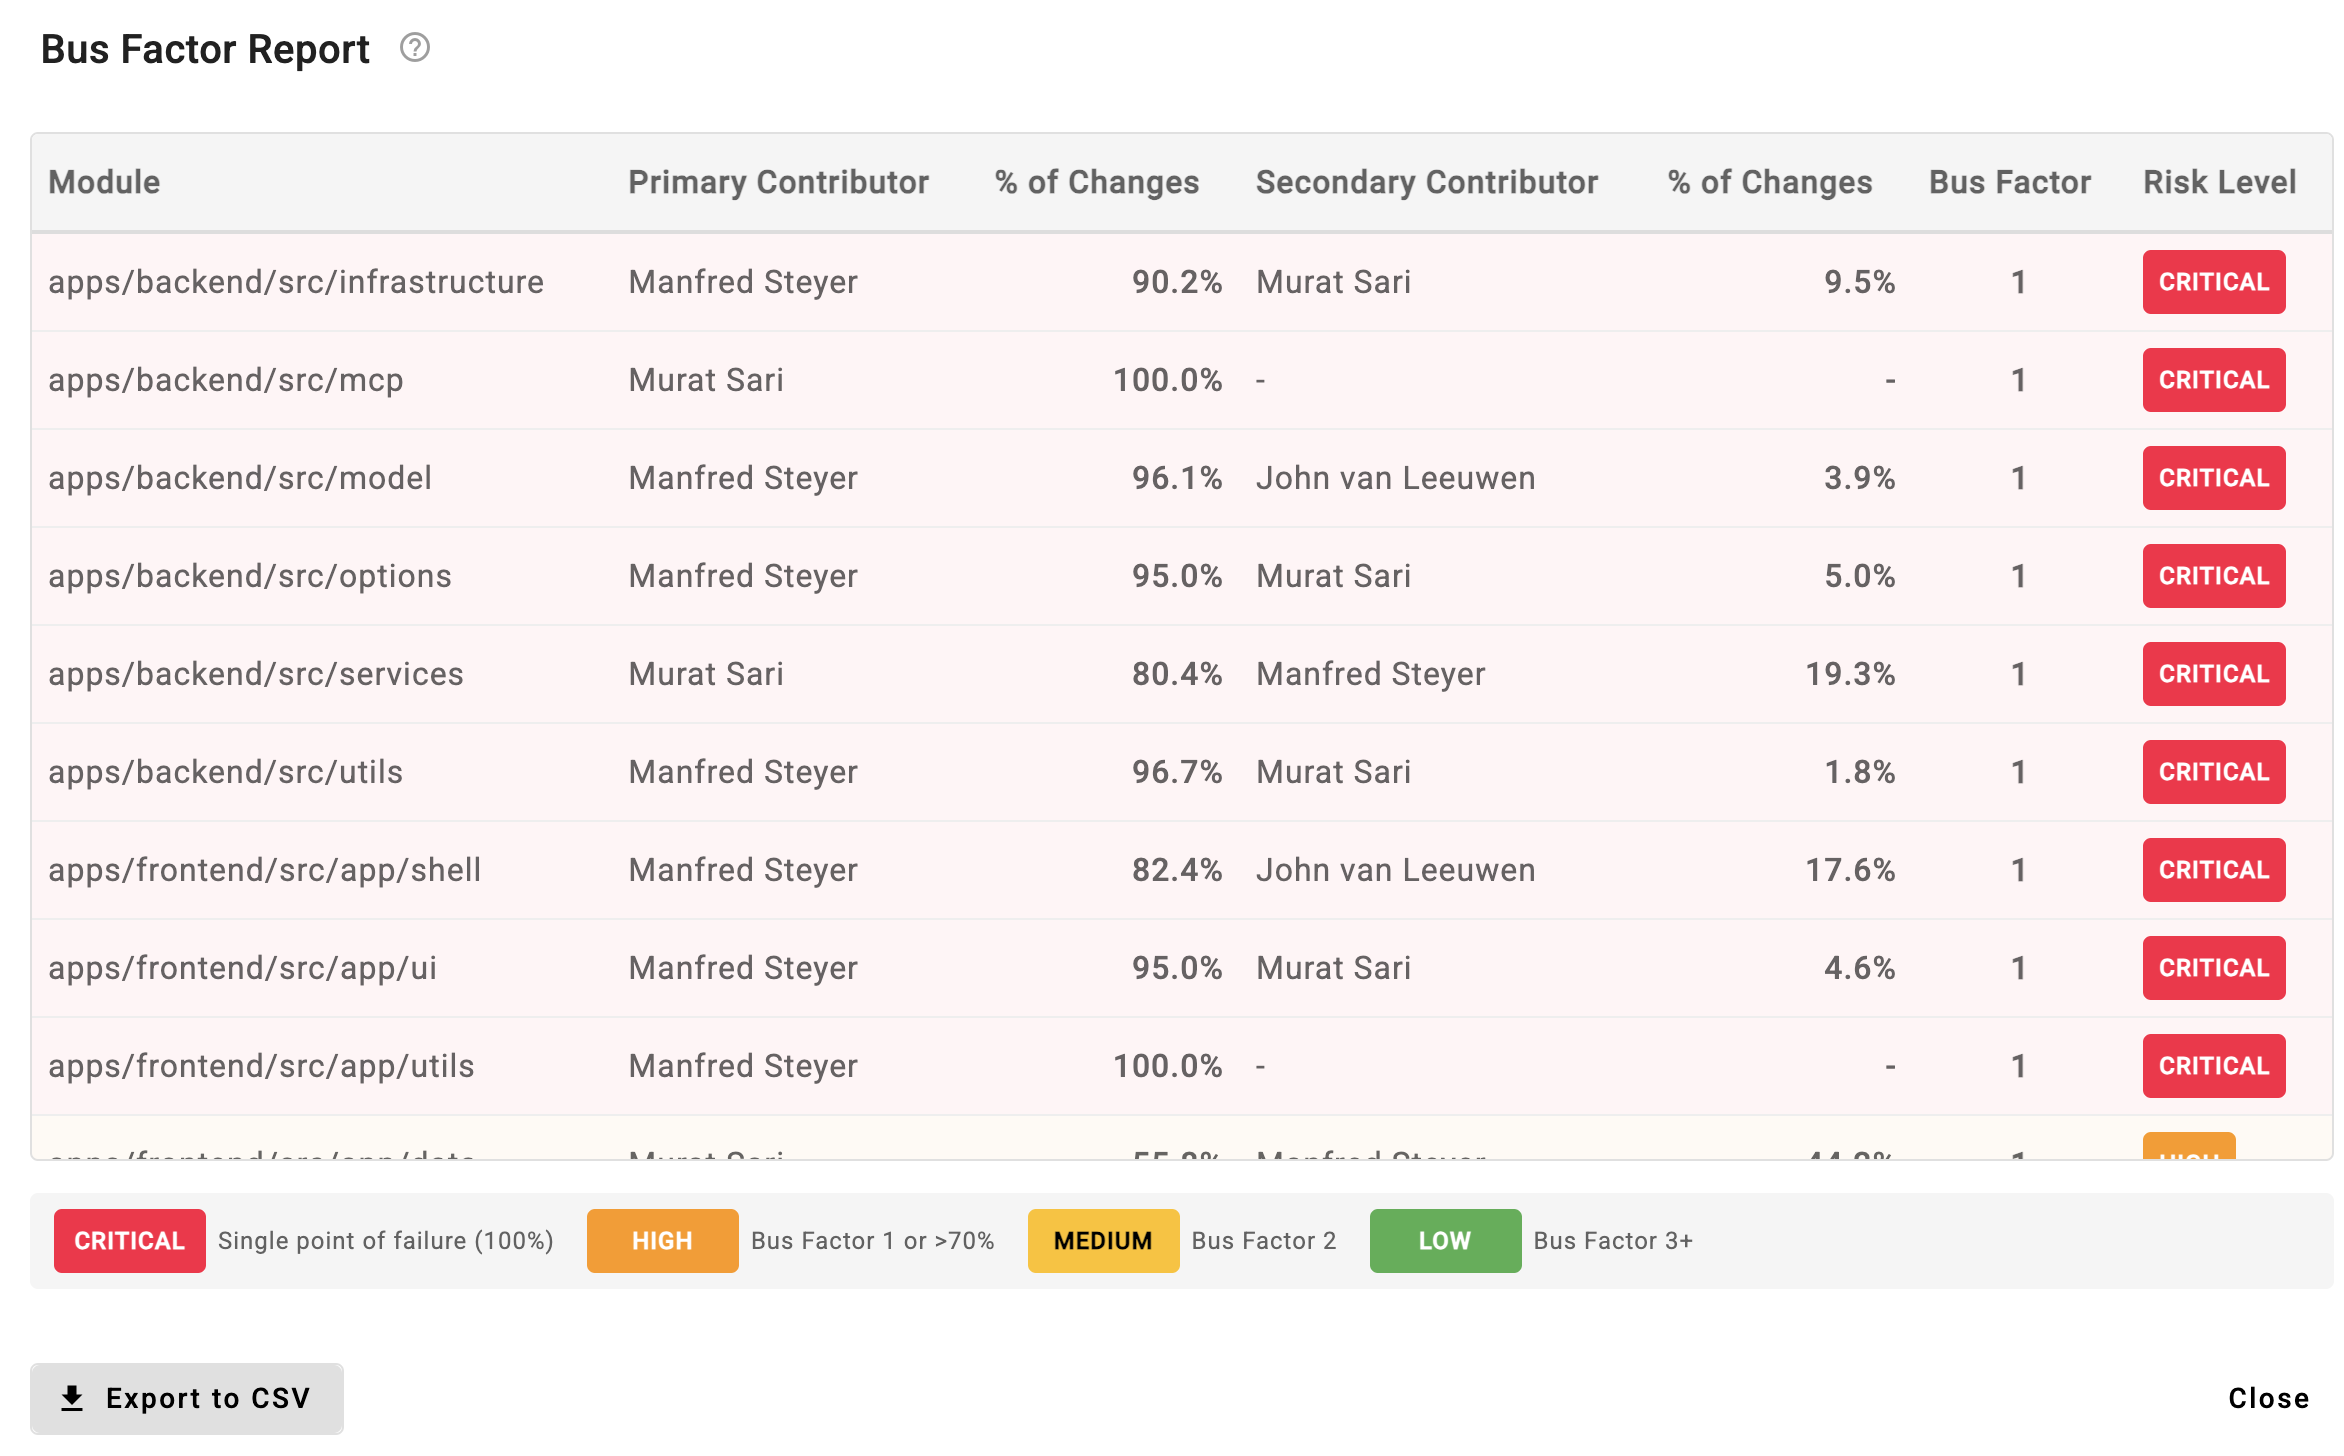
Another area we improved in Detective is the “Bus Factor” within Team Alignment. The data already existed, but it wasn’t shown in the UI.
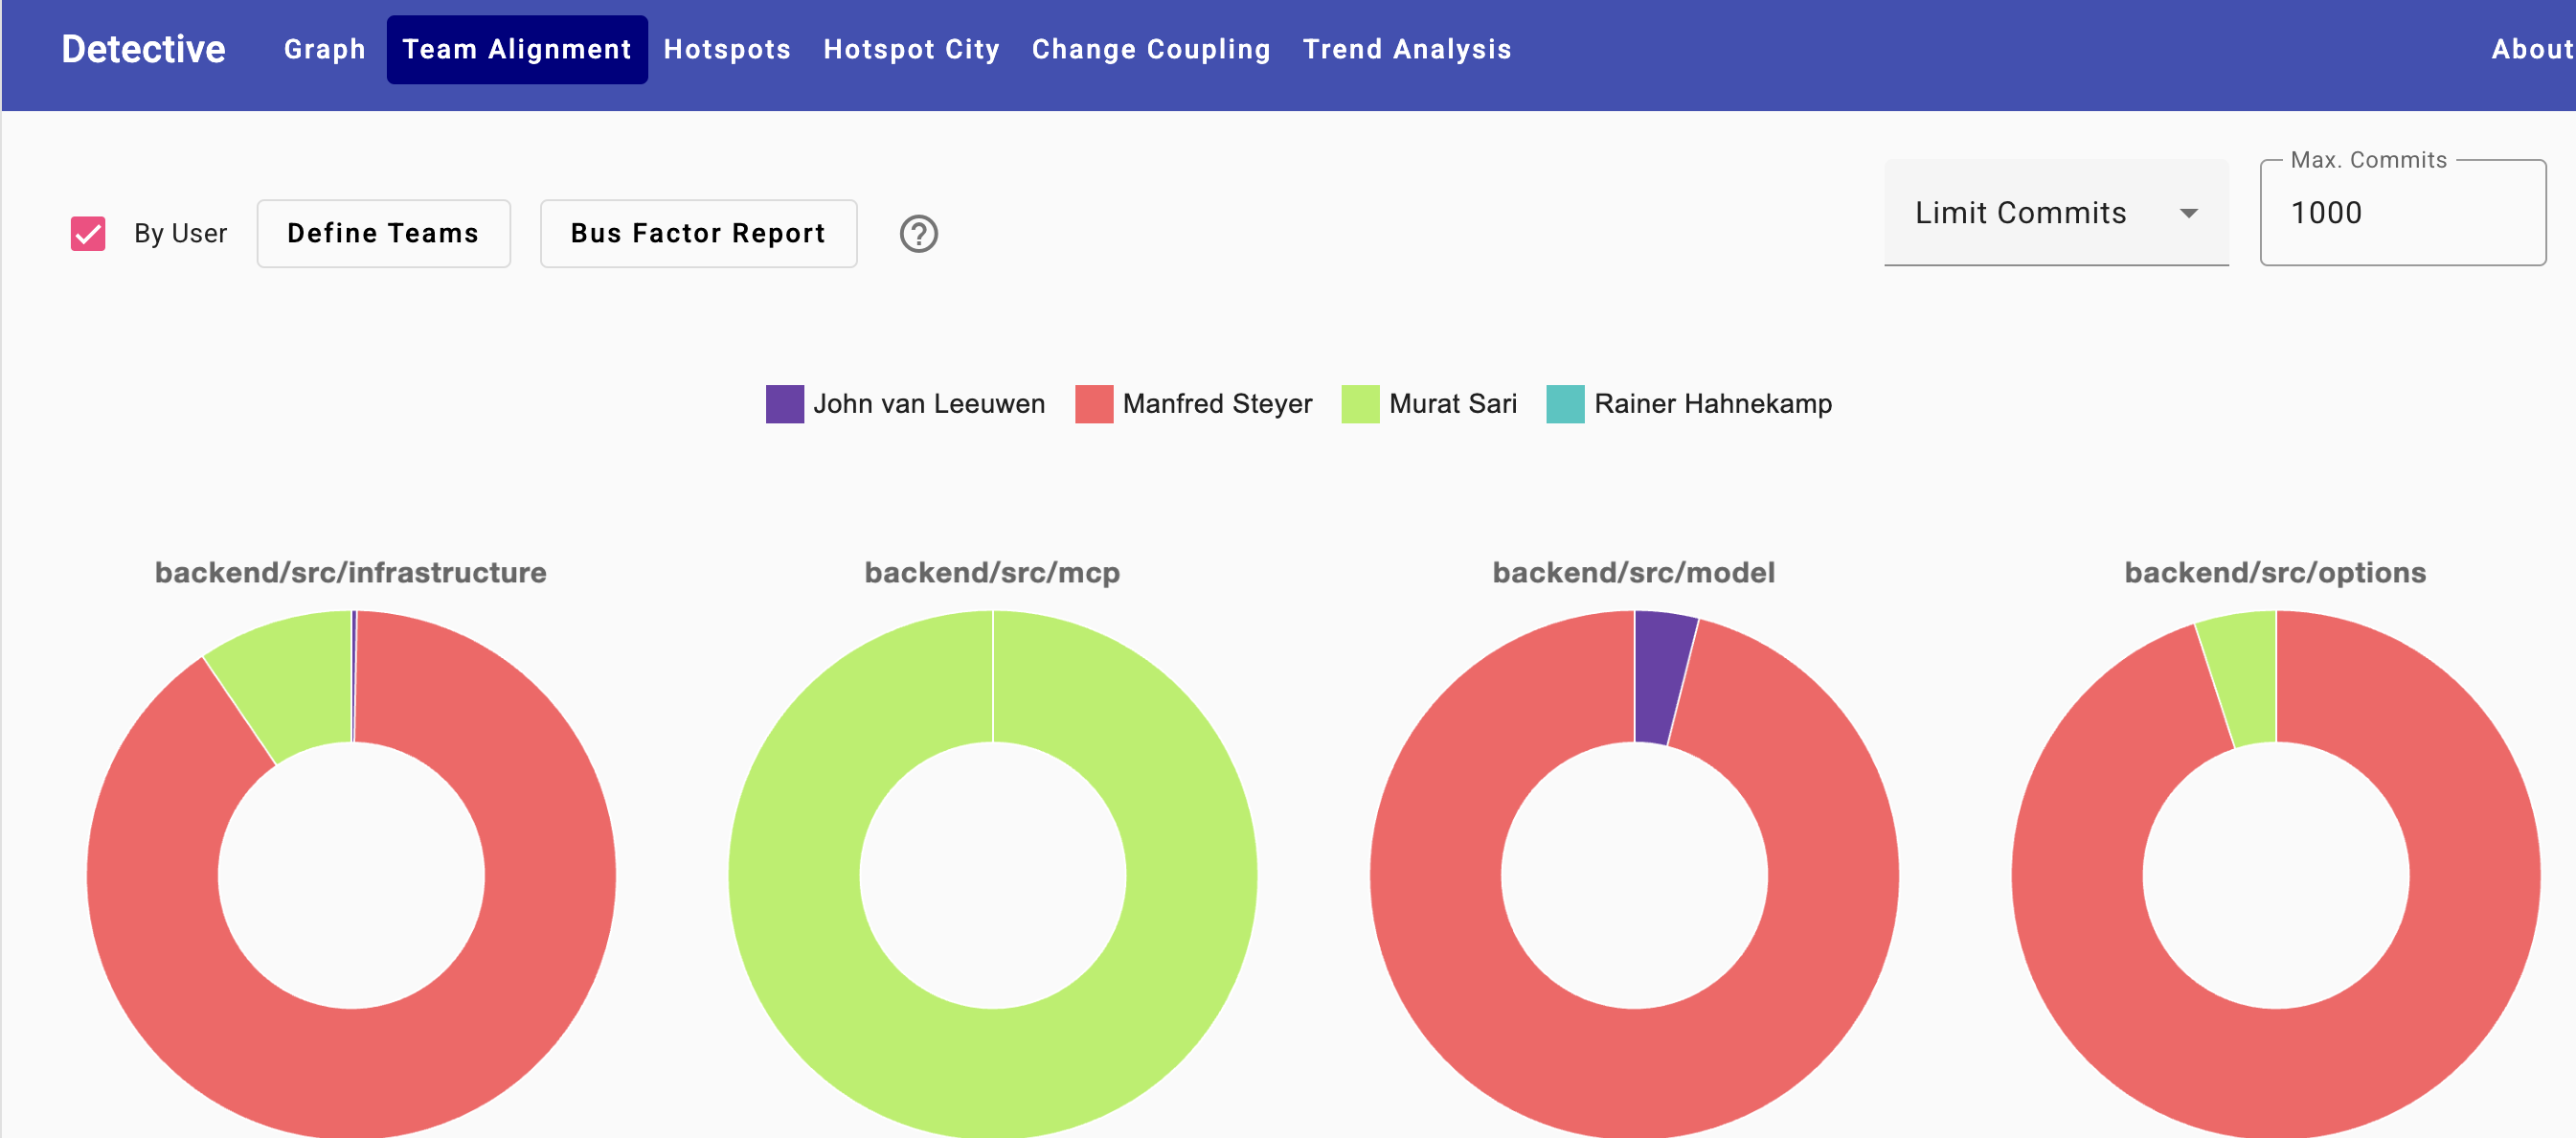
Based on the selected modules, we now display a table with the primary and secondary contributors. This helps identify areas that need better knowledge sharing and team rotation.
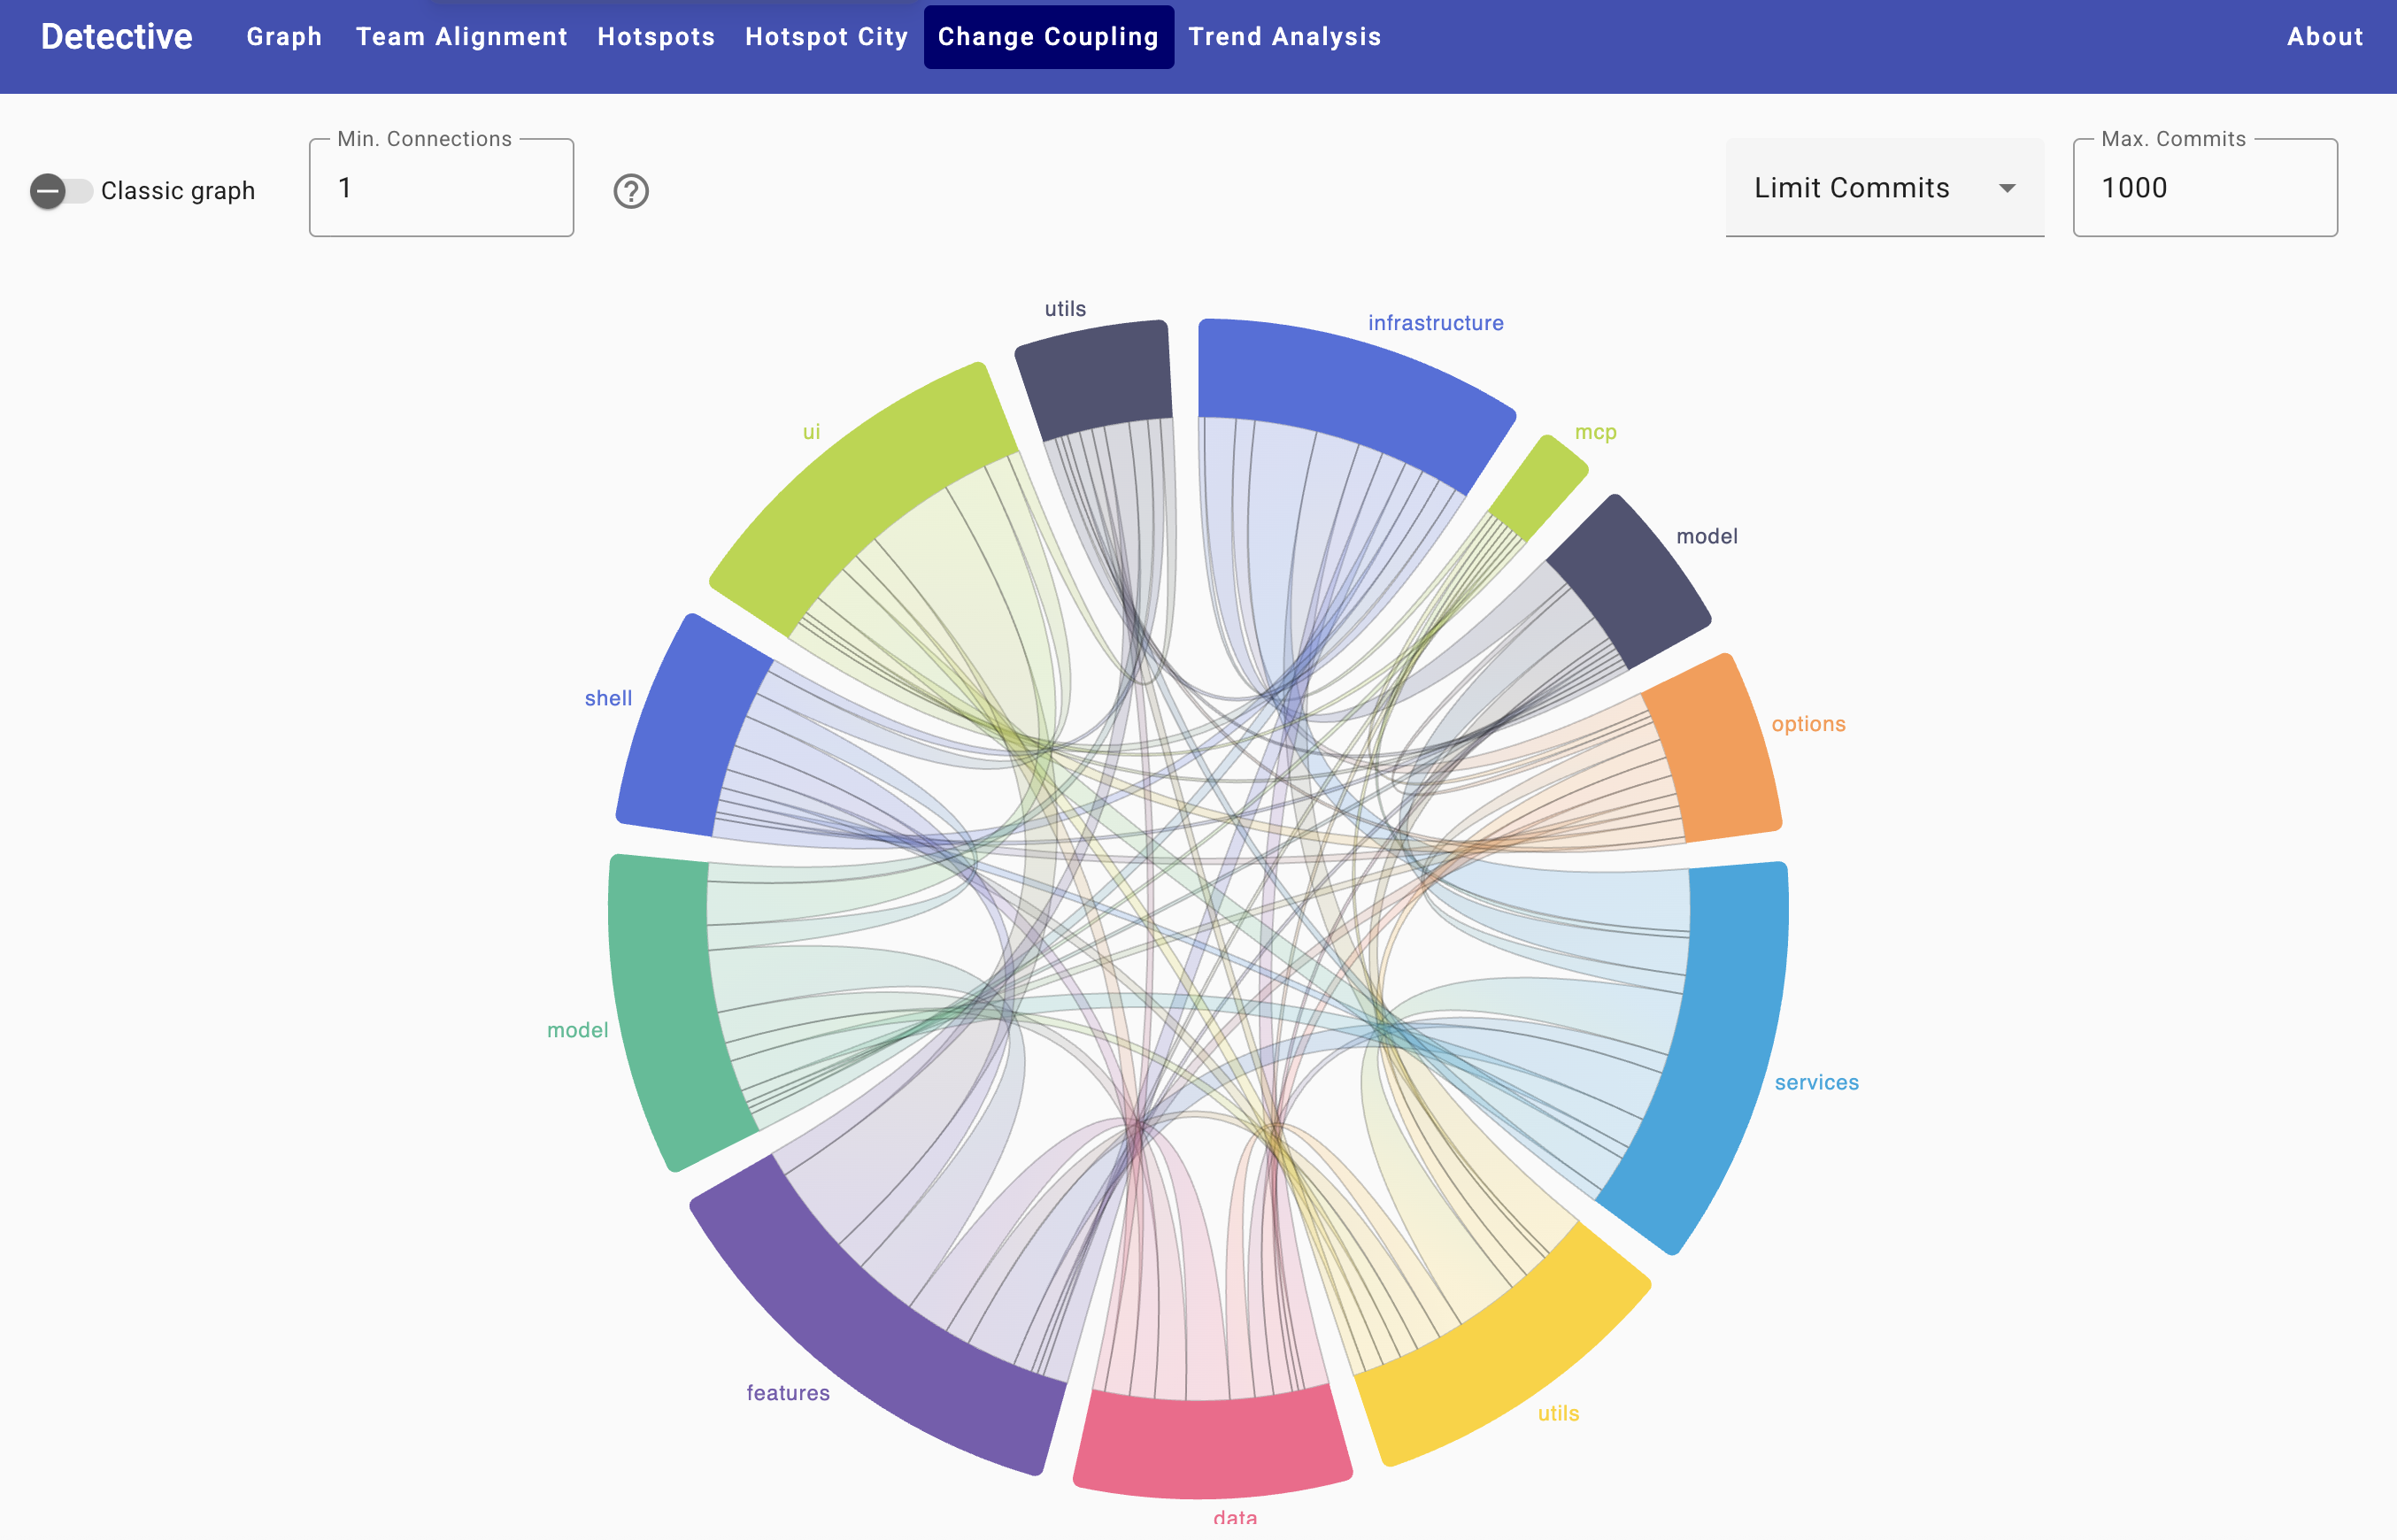
Within Change Coupling, we introduced a new, interactive chord diagram to make relationships easier to understand.
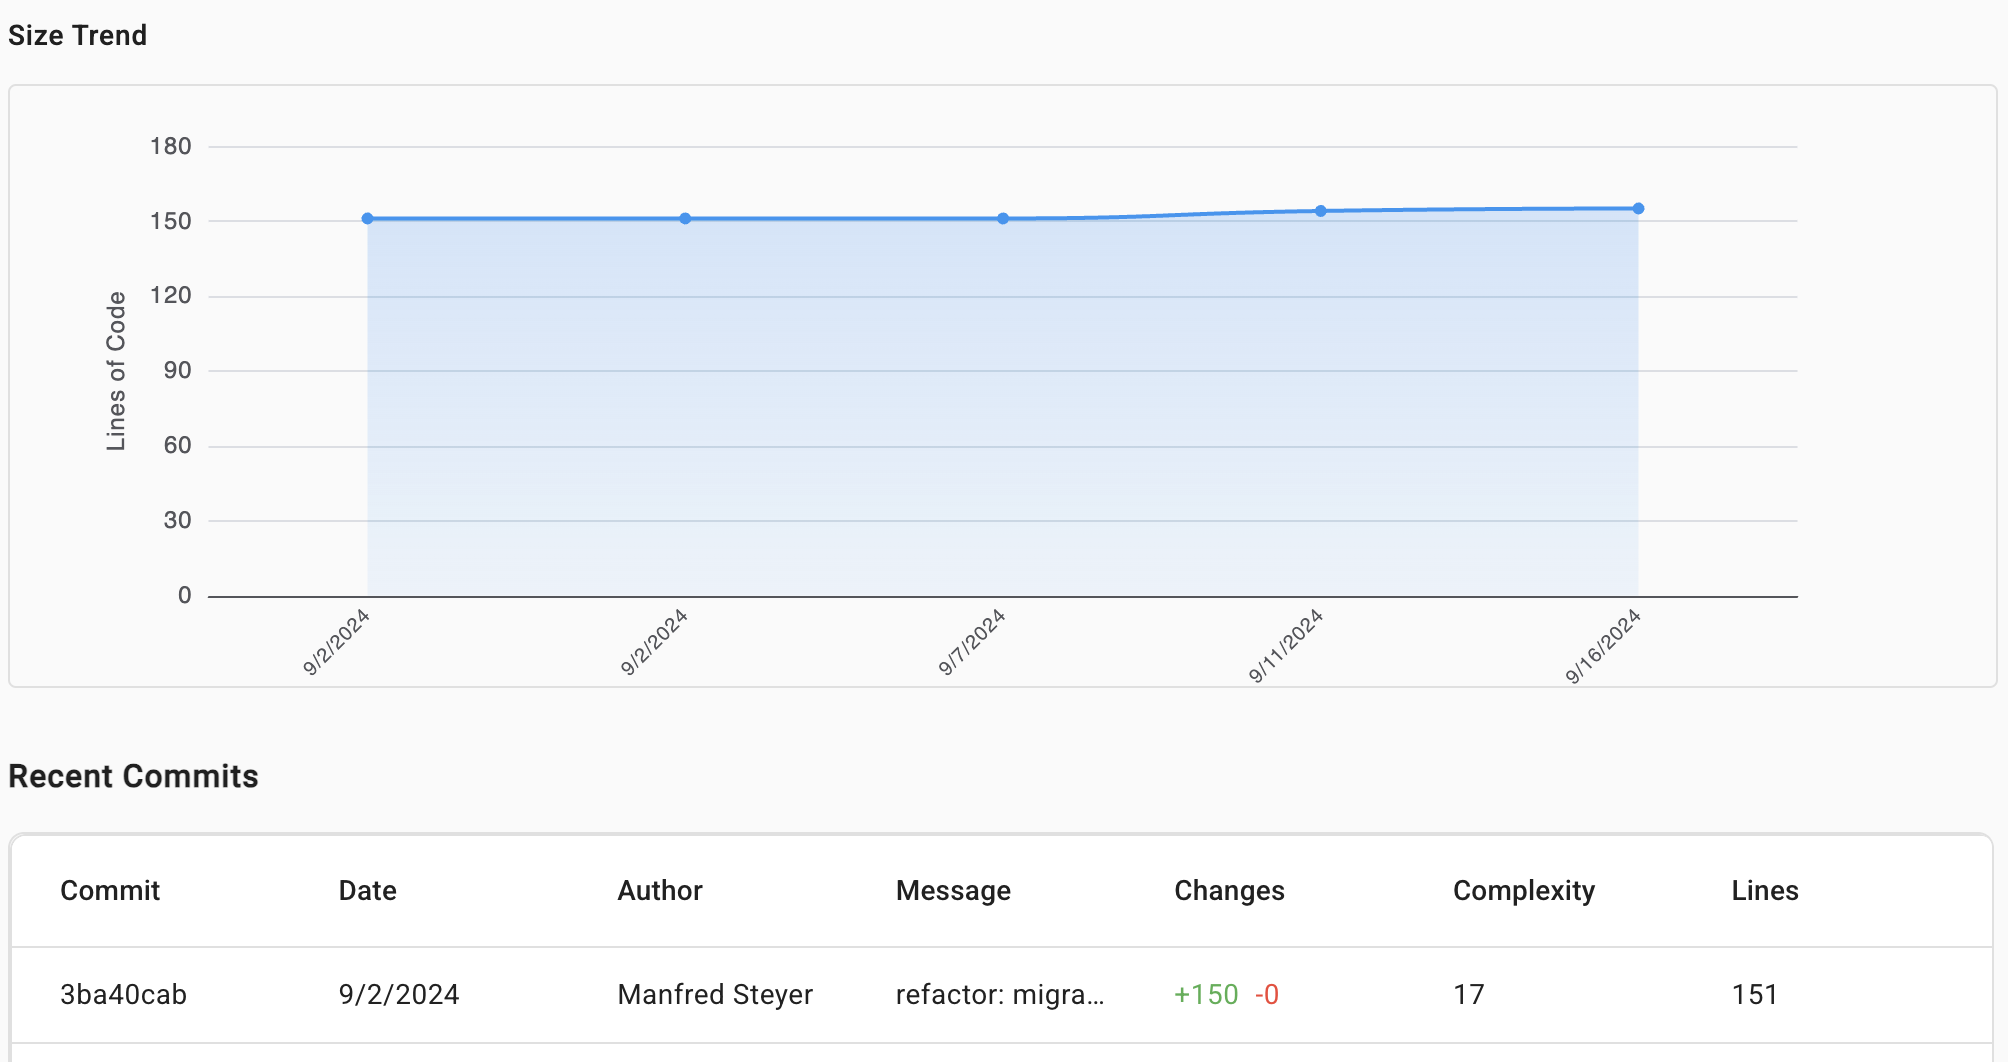
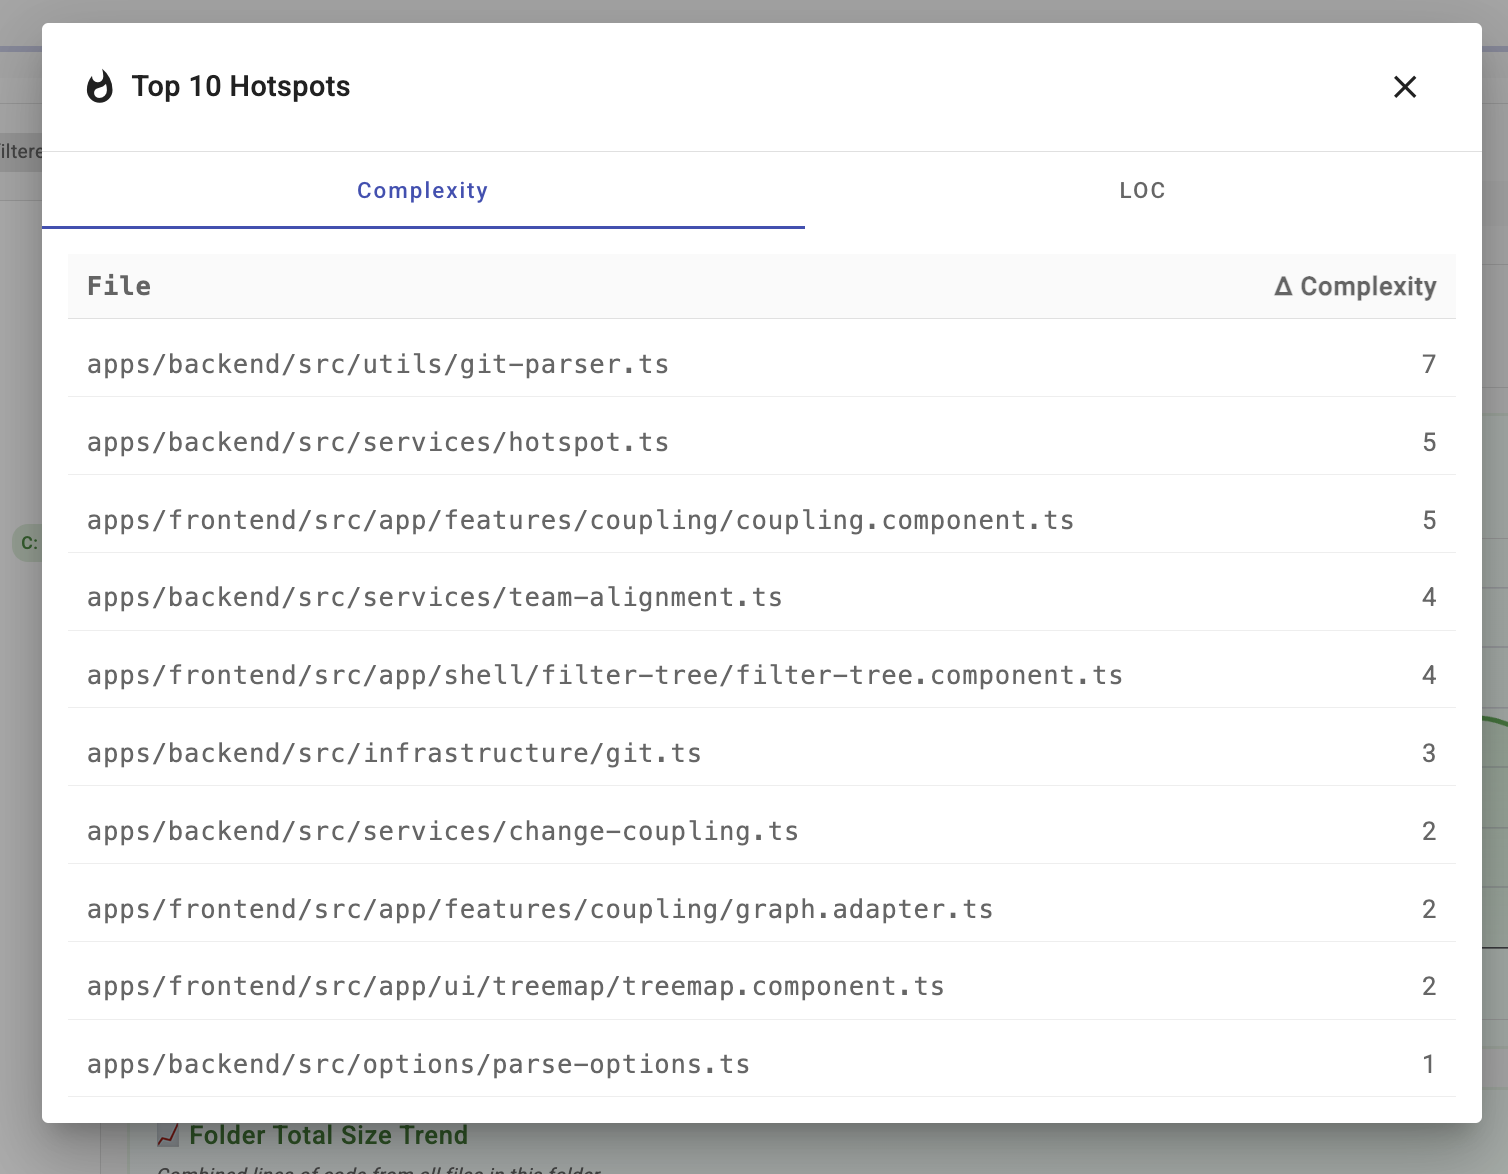
Last but not least, we added a brand‑new feature: Trend Analysis. Here, we iterate through each commit and each file and build trends for “Complexity” and “Size,” as shown below.
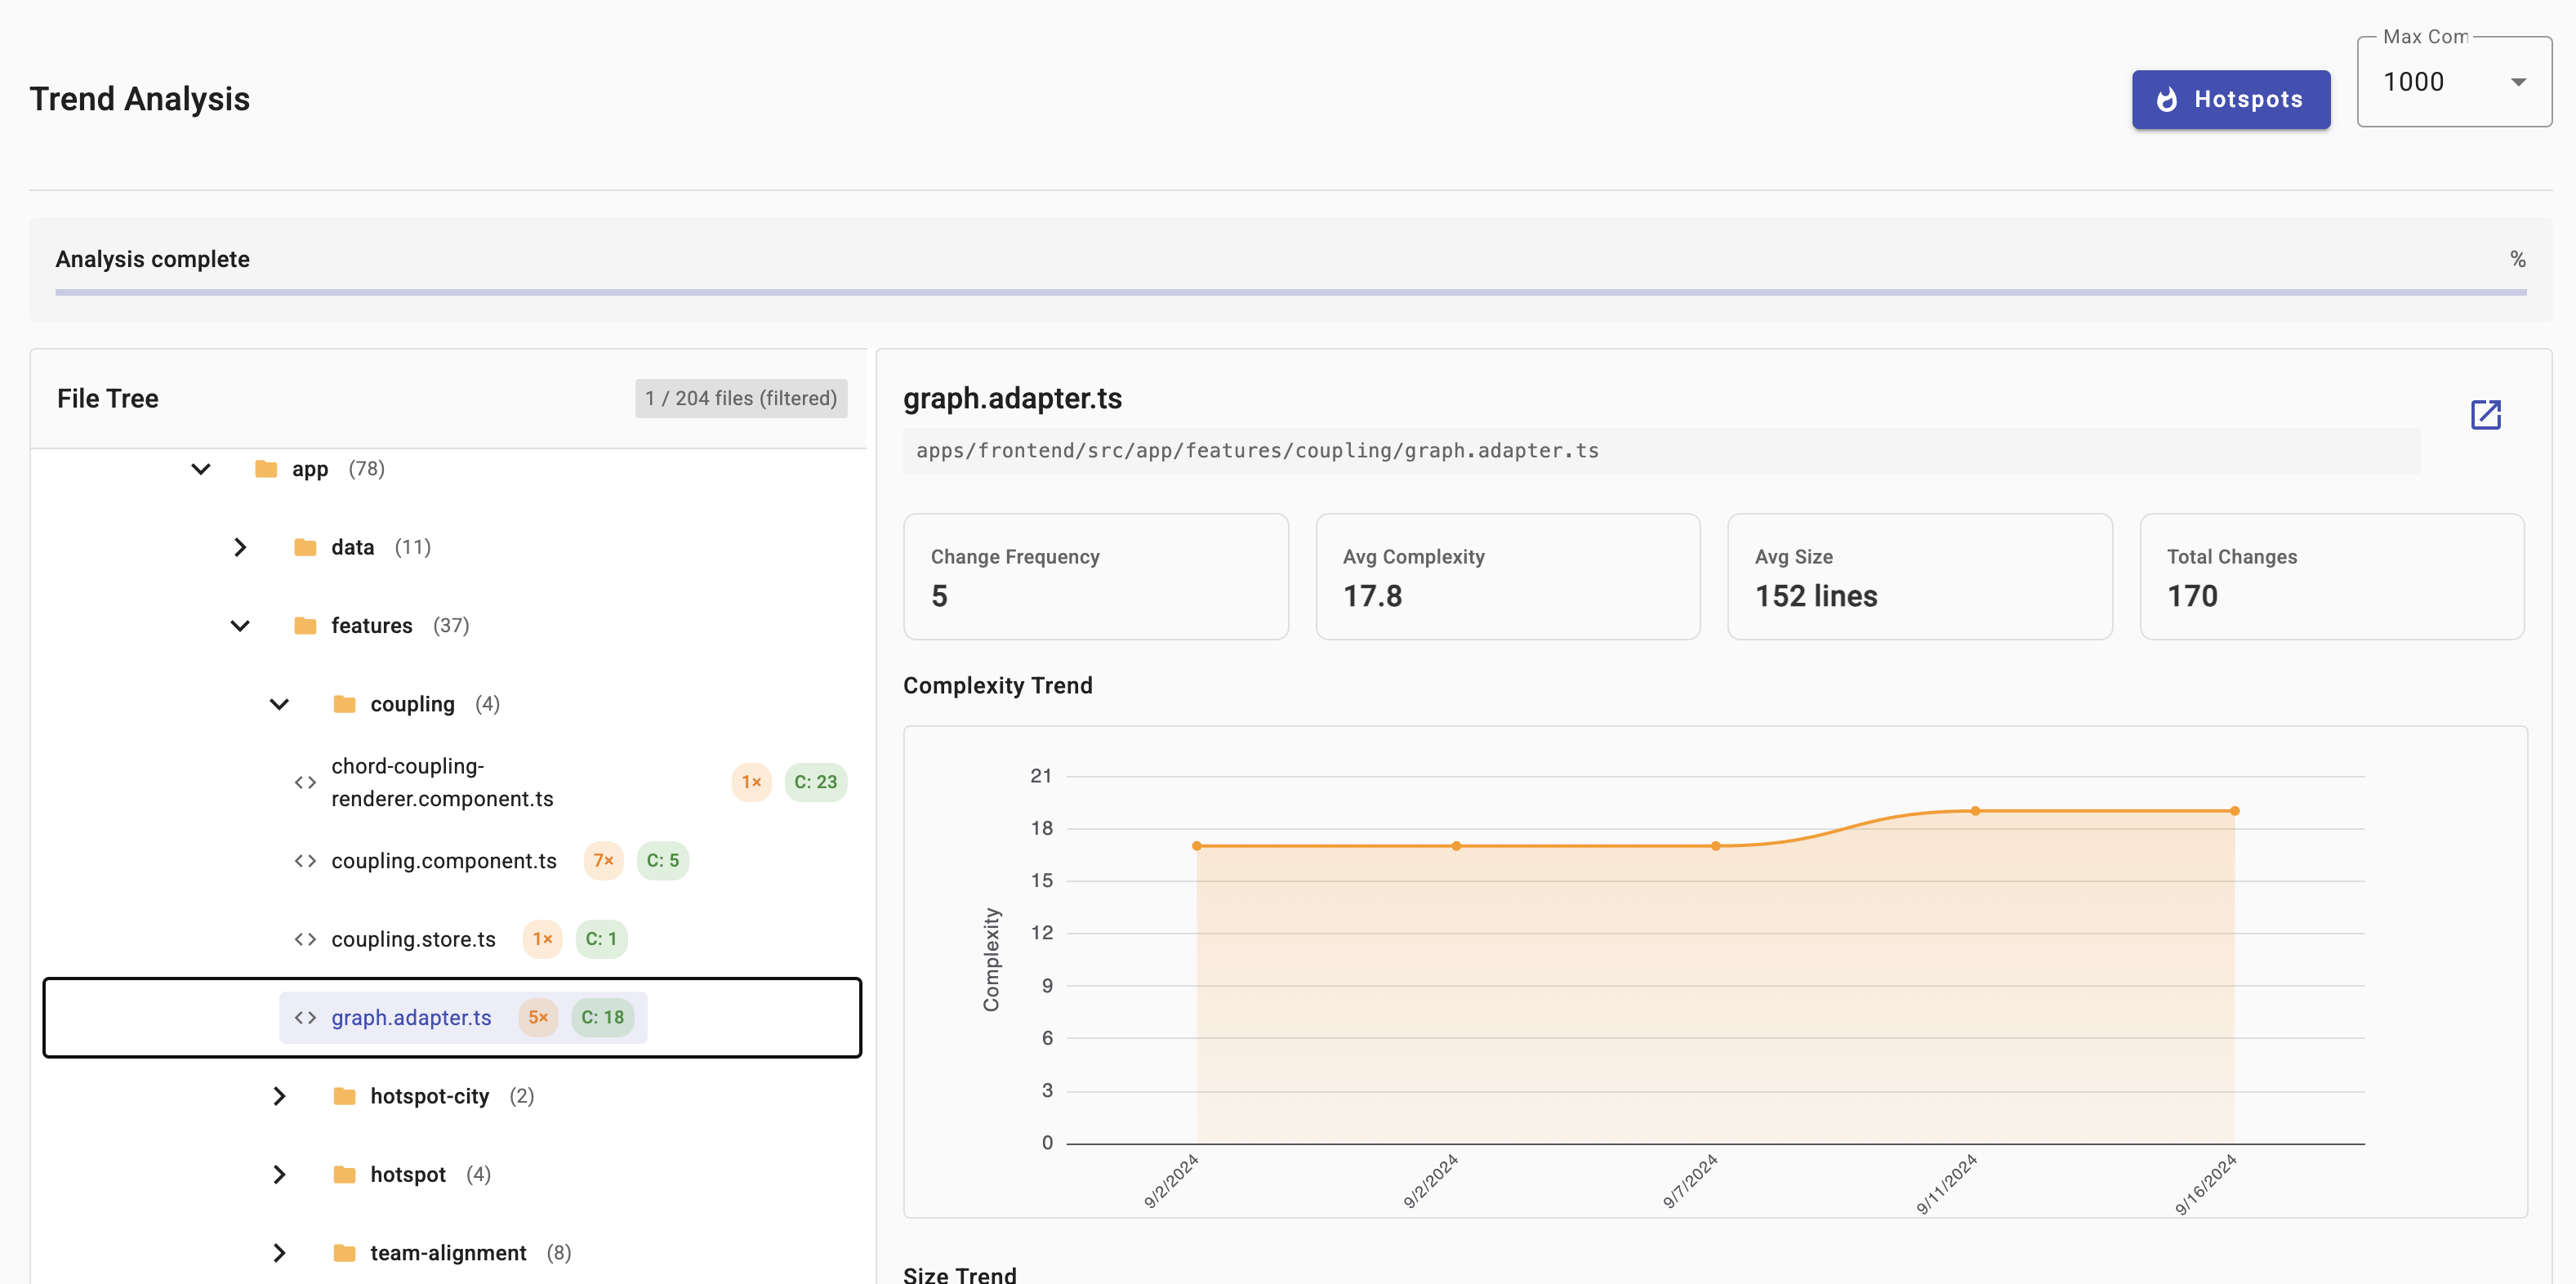
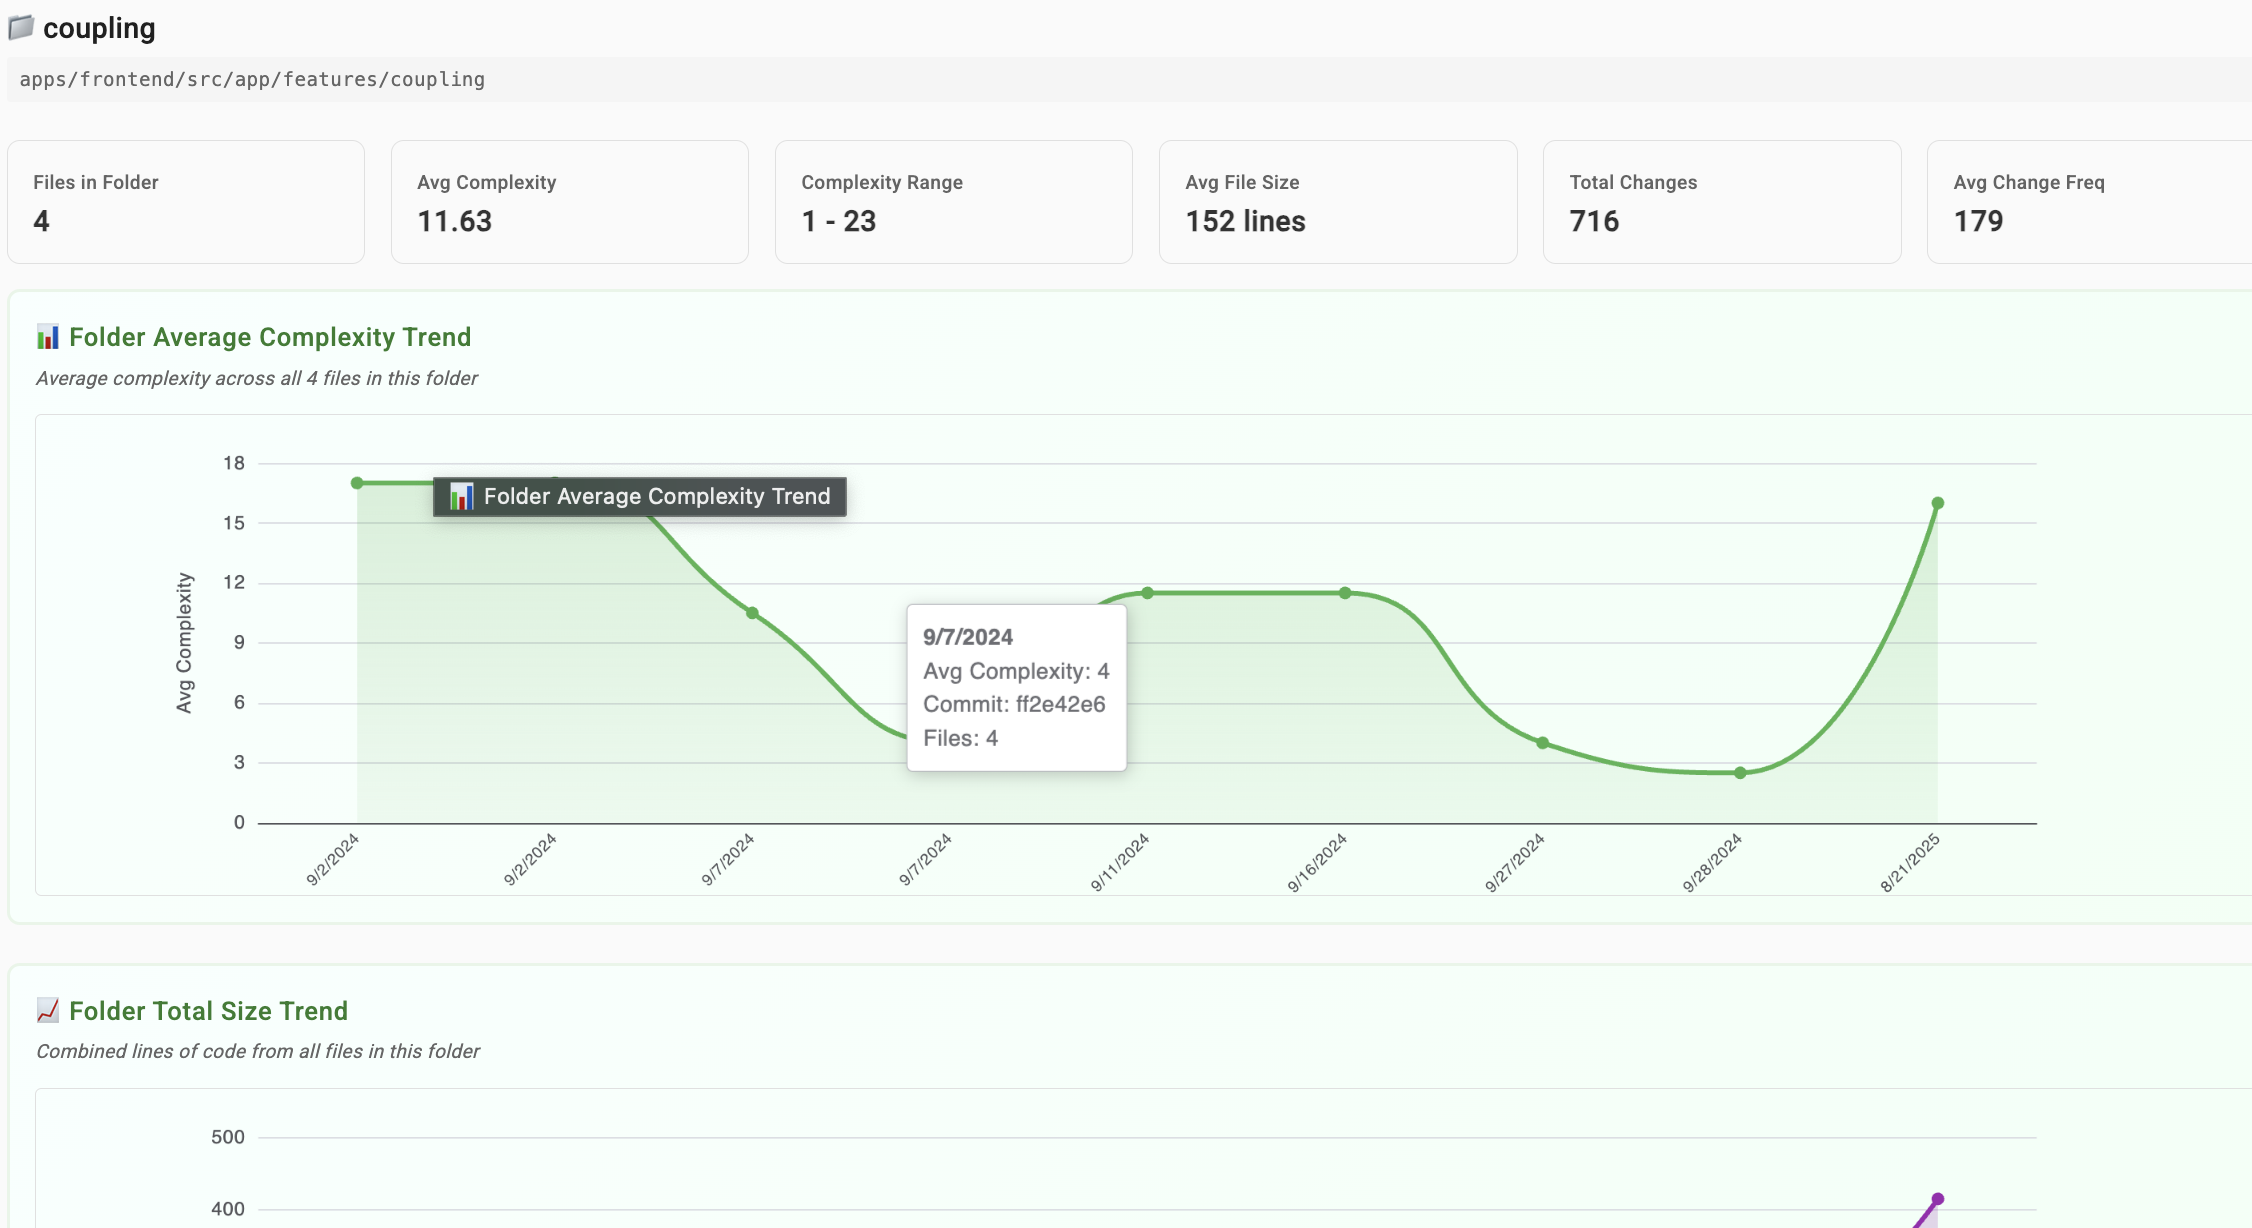
When you click a folder/module, we aggregate the trends to give an overview of all files contained in that folder.
You can also open the X-Ray analysis for the files in view to investigate further. Often it’s enough to look at the top ten files with the biggest changes in complexity or LOC and jump straight into their X-Rays.
These are substantial changes, and I have more ideas for Angular‑specific metrics based on templates that could catch additional anti‑patterns.
Next Steps: Request Your Code Review
With our code reviews, we help you achieve your architectural and quality goals. In addition to the code analysis described here, we apply several other techniques and take established community best practices into account. As a result, you receive a 360° view of the overall “health” of your implementation, along with a prioritized list of recommendations.
Request your review now — and let’s make your Angular solution future-proof.
Conclusion
Detective’s new capabilities—Hotspot City, X‑Ray metrics, Bus Factor insights, Change Coupling’s chord diagram, and Trend Analysis—turn raw repository history and code structure into actionable signals. They help you spot where complexity is growing, where responsibilities leak across boundaries, and where knowledge is concentrated in too few hands. The goal is not to replace judgment but to focus attention where it matters most.
Give it a spin on your codebase: explore the city, drill into X‑Rays, review the top trend movers, and use the findings to guide refactoring and team conversations. I’d love feedback and ideas—especially around Angular‑specific template metrics—to make these tools even more insightful.